 |
 |
 |
Organizational Charts (also known as Organigrams) are diagrams that represent the structure of an organization and the relationships and ranks of its parts, divisions and roles.
The Organizational Charts PowerPoint Template is a set of comprehensive Org Charts, with different structures generally applied in organizations. Users can describe the different employee relationships and reporting structures with the following frameworks:
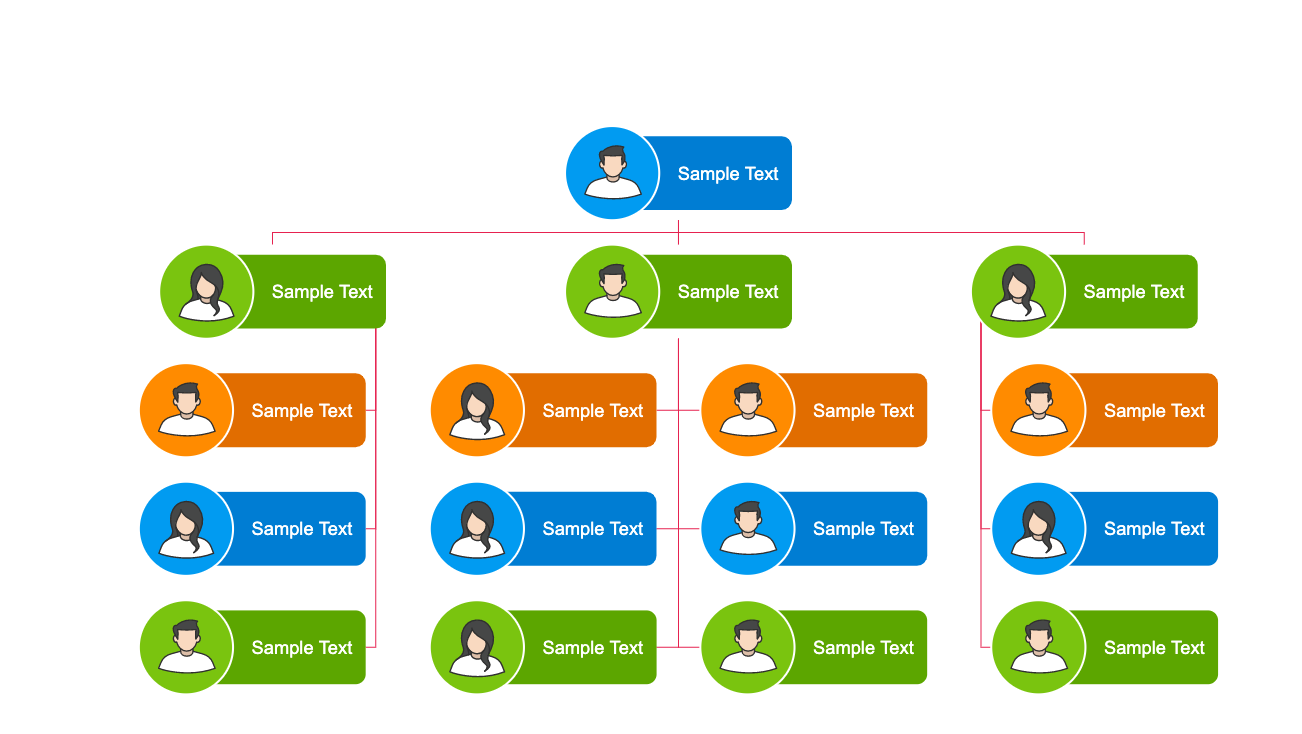
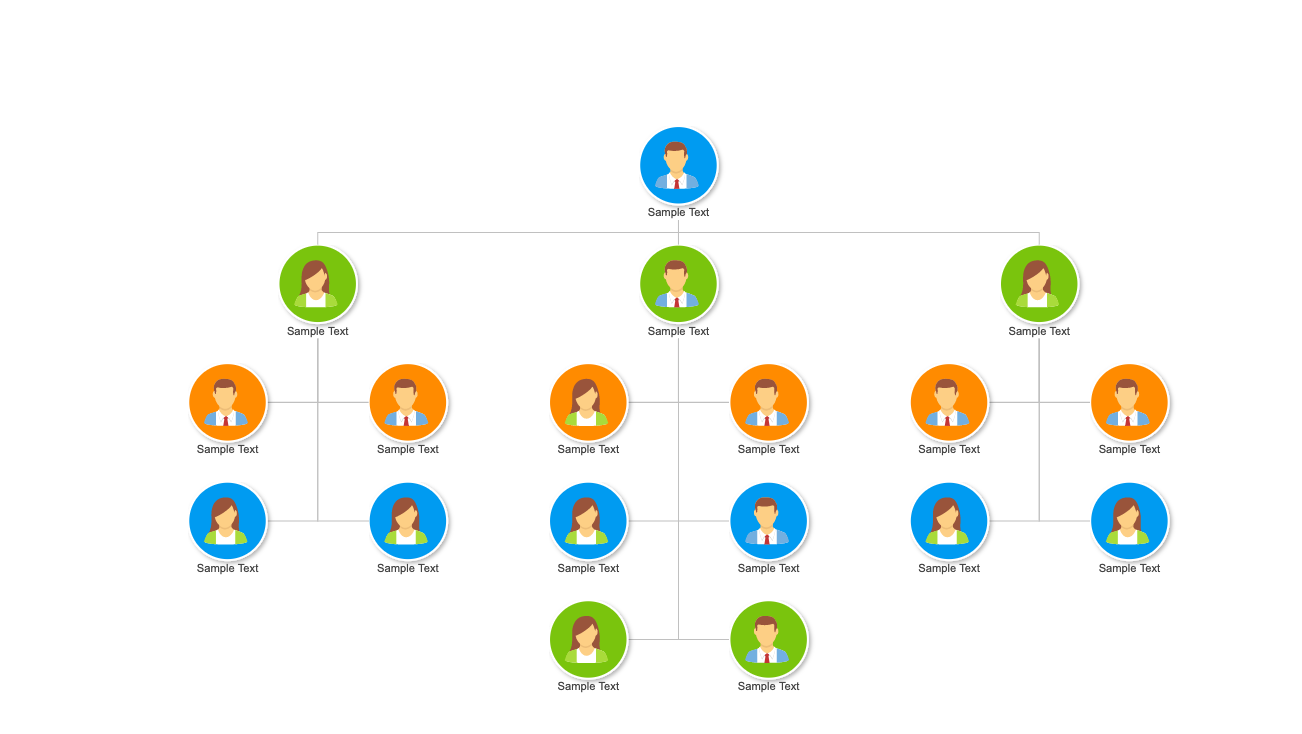
- The Traditional Tree Organizational Chart.
- Hierarchical Org Charts. This diagrams represent structure where every entity in an organization, is subordinate to another entity.
- Functional Organizational Chart. This diagrams represent organizations divided into “functional” divisions, where each can be structure individually.
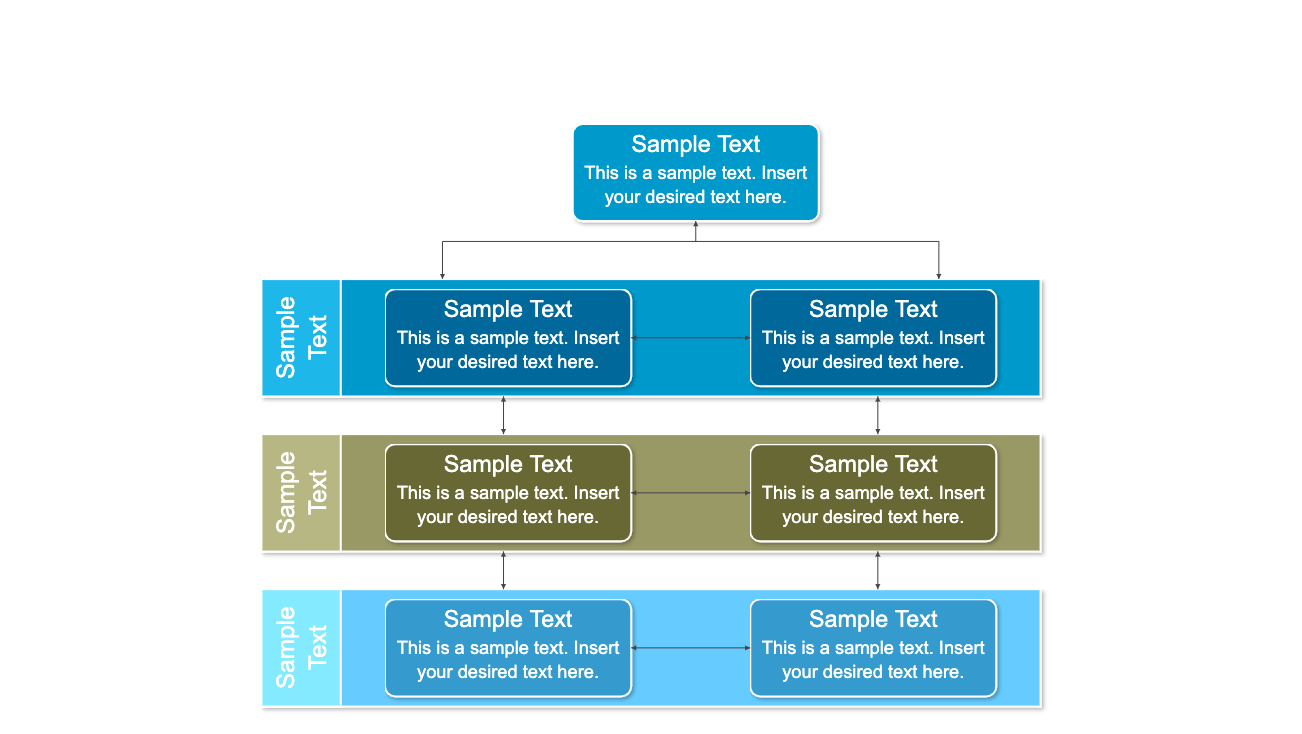
- The Layered Organizational Chart. This diagrams represent entities inside a layer (flat relationship) and the hierarchical relationship between layers.
- The Matrixed Organizational Chart.
- A Circular Org Chart. This organizational charts are a special visualization of a matrixed organizations.
The Template provides avatars in order to describe people and roles. It also provides generic stock photos to describe real people in the charts. Each people placeholder can be easily edited by the user in order to replace it with proprietary content, photos or icons. Each of the placeholders is created with PowerPoint Shapes. The user can customize the palette just changing the template theme.
Create Professional Organizational Charts with SlideModel.com and impress your audience.