 |
 |
 |
Simple Infographics 3D Charts for PowerPoint – Creating Infographics is a regular task in todays modern workplace. Information is better understood with a clear infographic rather using a memo, or a dull document. Business executives are trusting more and more in the infographics their area managers deliver, and in a quick glance, key performance indicators can be monitored in a intuitive fashion.
Ranging from crating Human Resources banners to communicate importan information to the workforce (for example the statistics of the overall company 360 evaluation) to presenting complex user behaviour of purchasing, infographics are getting noticed as an important tool in todays businesses.
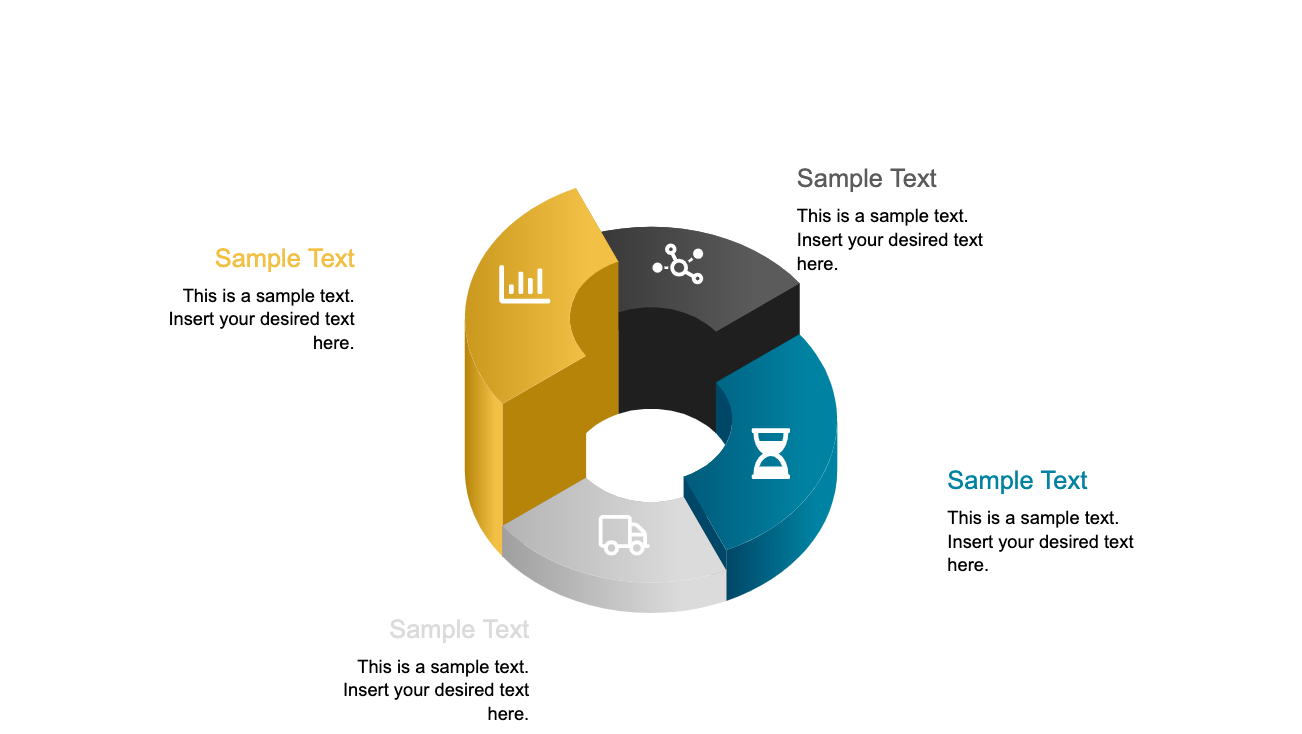
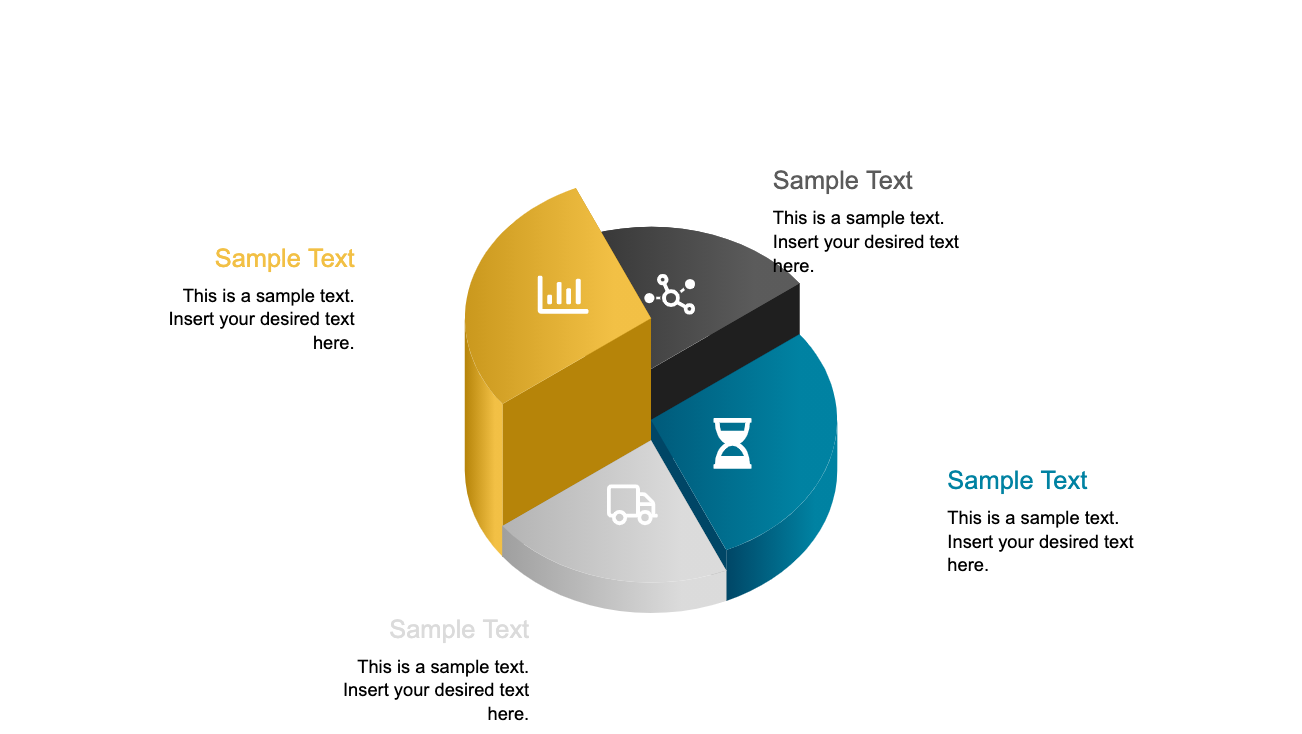
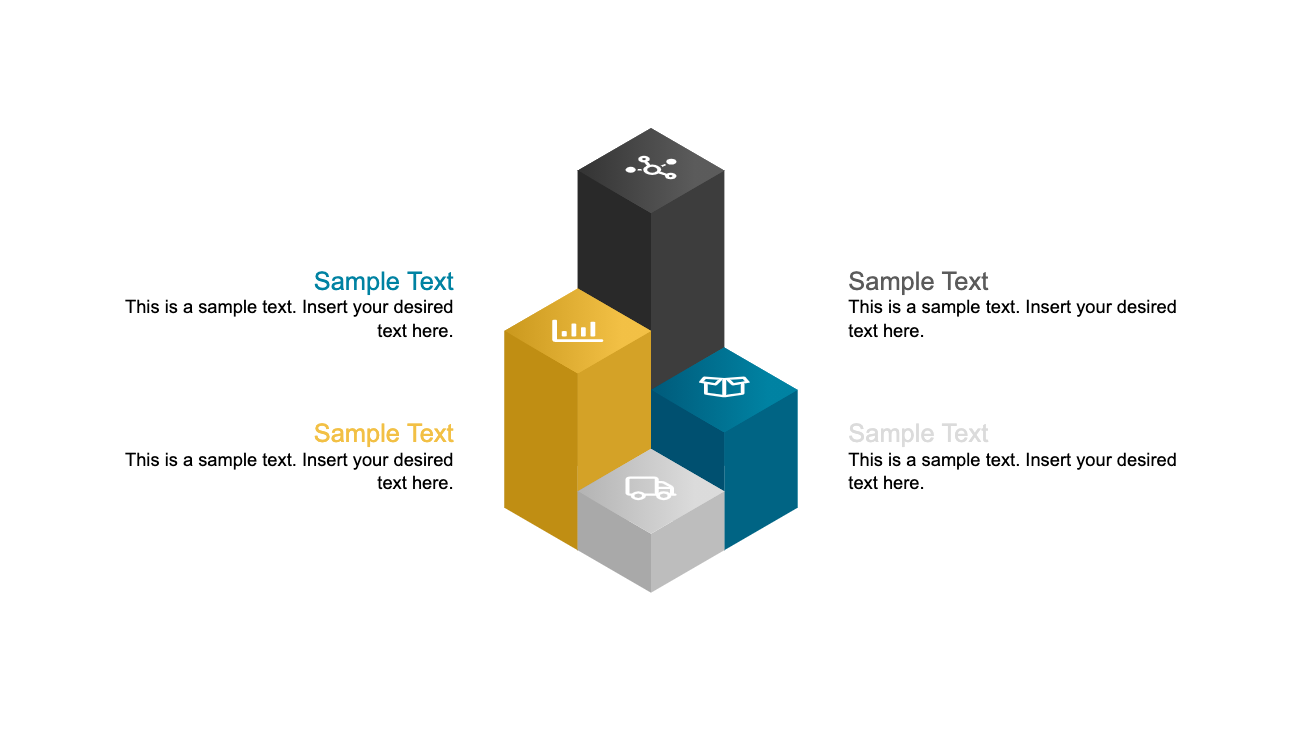
The Simple Infographics 3D Charts for PowerPoint is a classical set of 3D PowerPoint charts ideal for including in your next infographic. The assets provided are:
- Cylindrical steps Chart. Ideal for simple statistics of percentage share.
- 3D piechart icons with different sections blank.
- 3D Column charts in diamond style.
- Clustered column charts forming a wider column.
- Perpendicular Bar Charts formin a helix.
All the elements are created as PowerPoint objects allowing the user to fully customize their appearance and adapt it to the lok and feel of their own theme. A set of flat icons is provided for decorating the infographic charts.
Impress your audience with infographics that appeal to global executives.