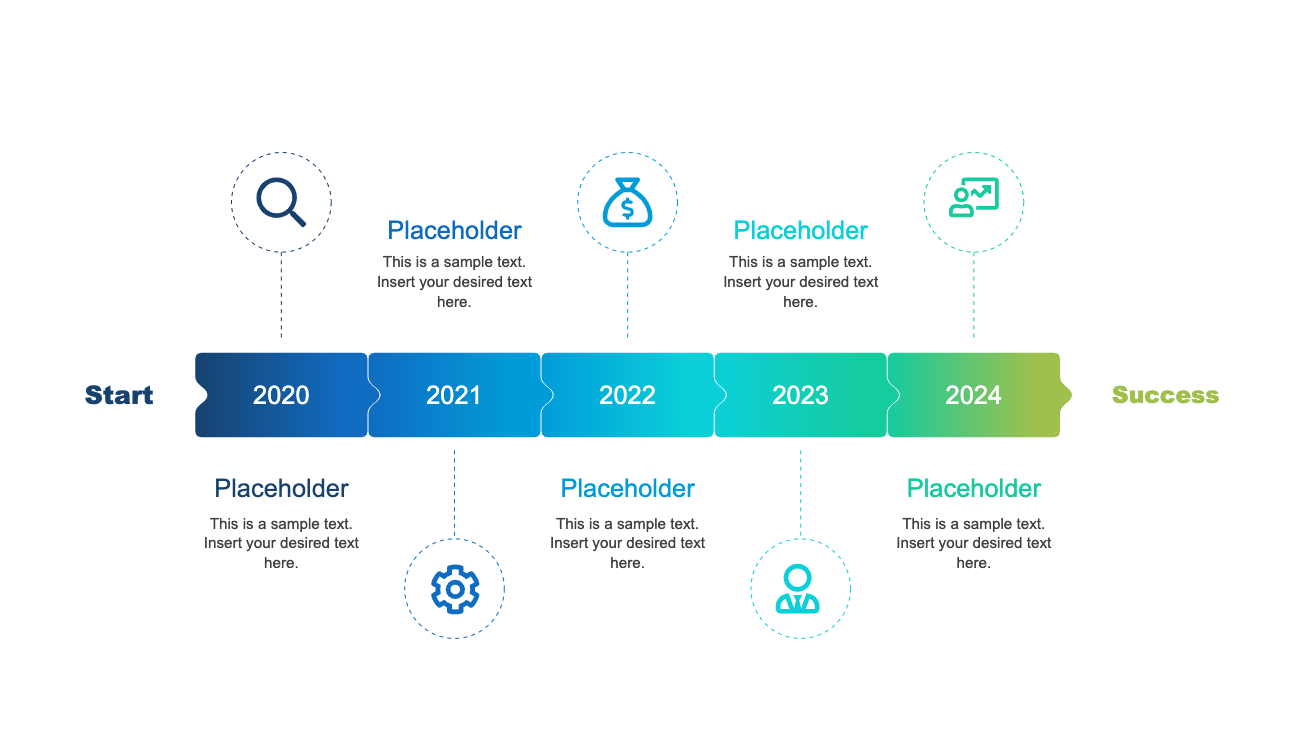
The Yearly Basic Timeline Diagram is an infographic slide layout to visualize linear sequence of events. It is a horizontal timeline with up to ten segments showing yearly progress. The template can represent progress of a process, project, or an organization. Many industries use timeline charts in present a chronological order of list or events. Most often, these timeline templates demonstrate 3-5 years past performance and growth of a company. However, it could aid in discussing business development plans or defining and monitoring important milestones of project etc. In short, the timelines are business presentation tool to deliver a broad overview of sequence of events in time.
In this diagram, milestones have ticket-shape, different from traditional chevron segments timeline. The colors move from blue to green, creating a gradient effect in timeline. While each segment of timeline shows infographic icons as visual representation of major events. The audience can quickly grasp an idea of what presentation is all about. Users can replace icons according to presentation needs.