Visual Thinking Methodology PowerPoint Template is a set of professional editable slides that can be used to present the idea of visual thinking to the target audience in a way that can be easily understood and practiced through the use of slides as working a canvas.
Visual thinking is a new methodologie, popularized in business and sciences, that changes the way people processes information. It involves observing problems and solutions from different perspectives and make decisions based on the analysis of visualisation created during the creative sessions. Visual thinking foundations are built over the fact that an important amount of information presented visually can be better retained by our brain, so it is therefore advisable to use the visual thinking methodology to come up with a robust solutions to problems or better prioritized decisions.
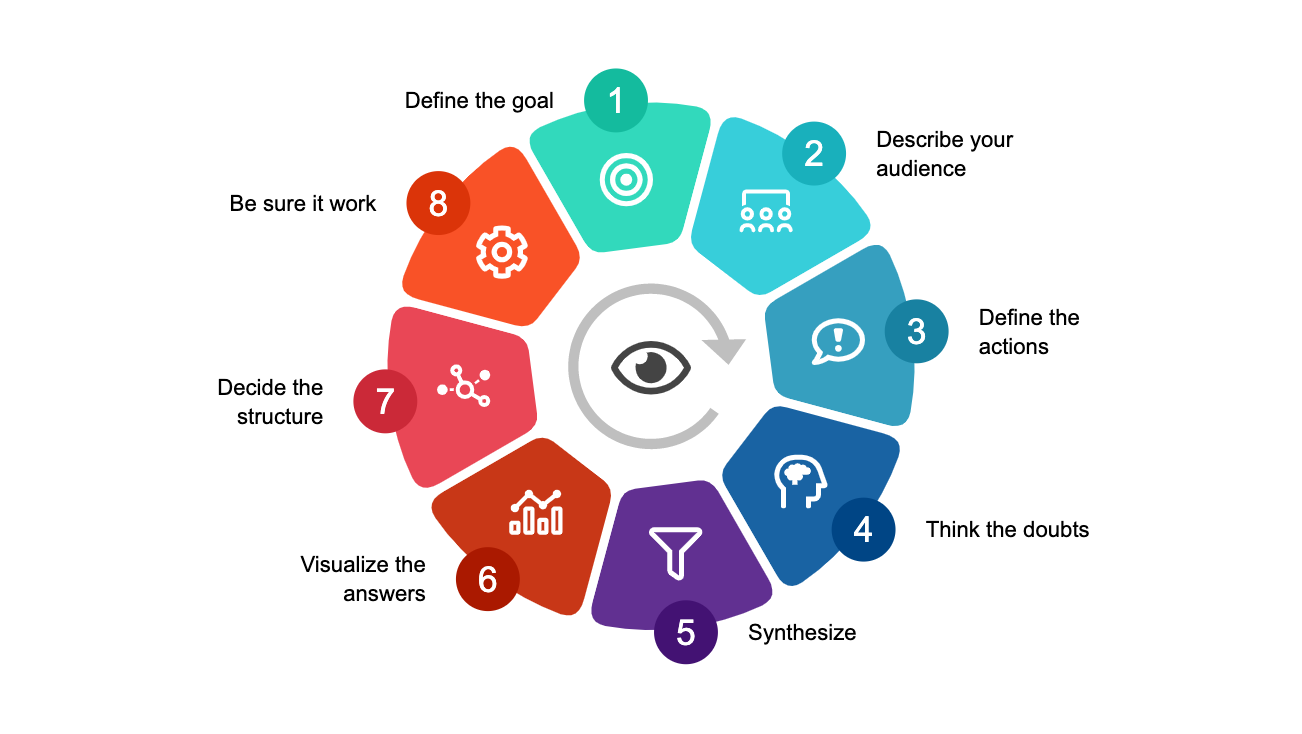
Visual thinking involves the following high level processes:
- Goal Definition
- Audience Description
- Definition of Actions
- Scenario Analysis and Q&A
- Synthesize
- Answers Visualization
- Structure Design
- Test the Hypotheses
This presentation is structured to provide businessmen and people interested in entrepreneurship a guideline on how to apply visual thinking to come up with great ideas, which would turn out to be new opportunities. The presenter can use the processes outlined in the template to enable entrepreneurs & business people to come up with idea maps, capturing ideas and concepts. Visual thinking can be used by individuals or groups in brainstorming activities to tap on the creative side of the individual or as a group. Visual thinking enables immediate recording of concepts, ideas & thoughts which can help in achieving goals. Colors and symbols can be used to distinguish processes and concepts, which can help plan in conceptualizing an idea or a proposal.
The slides in the template can be used as posters, brochures and other materials to reinforce the need of visual thinking as part of the process of improving current policies and the coming up of new ideas that can help start up new plans & projects. Each section of the PowerPoint Diagram is 100% editable and created as PowerPoint objects, allowing the user to fully customize the appearance.