The Non-Profit Vs For-Profit Diagram presents a business model spectrum for strategic planning. It shows major segmentations of business for social enterprise model. These segments include non-profits for impact on social values and profitable enterprise for financial values. This model for non-profits and for-profits is useful for explaining business activities that include a combination of both social enterprise factors. Because non-profit organizations also make profits like for-profit organizations. But the process of handling those profits differ in these organization types. This presentation diagram of business spectrum could help elaborate on bifurcate organizations.
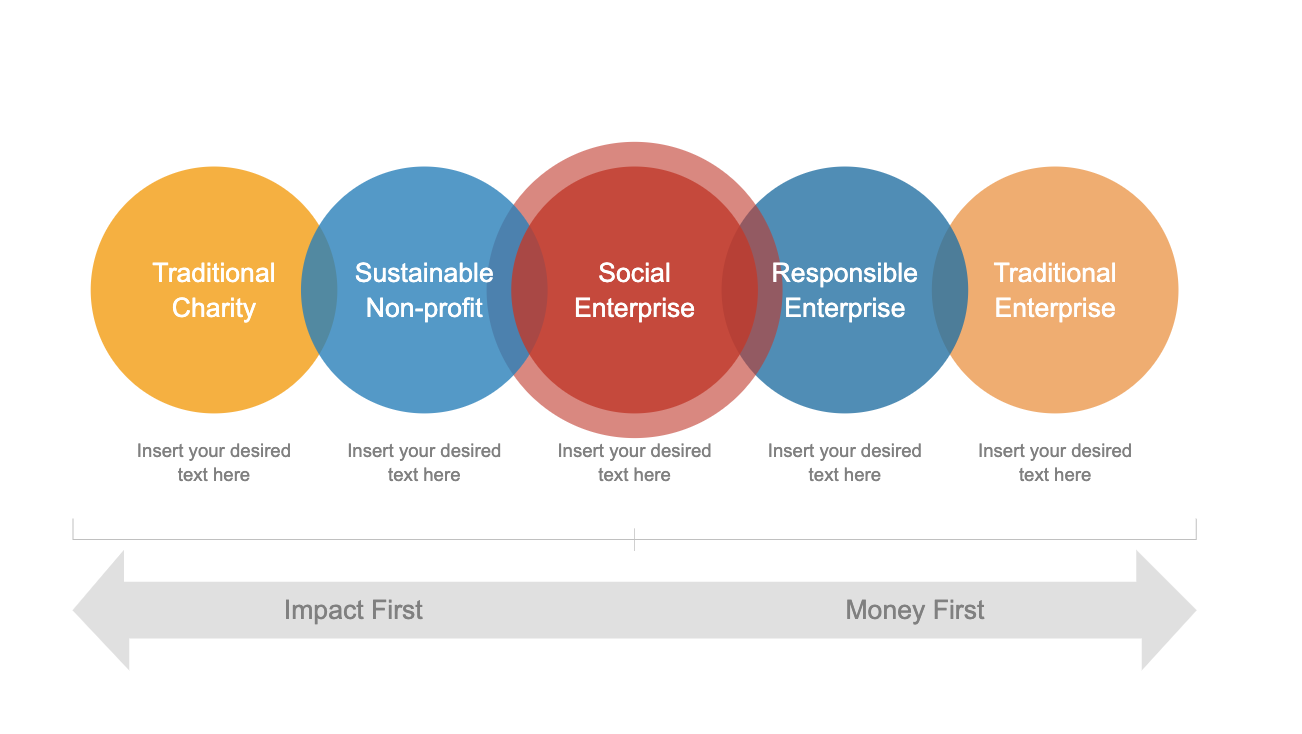
The template diagram for non-profits and for-profits includes up to ten connecting segments. These are flat circular shapes representing organization types. The segments include traditional charity, sustainable non-profit, social enterprise, responsible enterprise, and traditional enterprise. The slides also display a two-way arrow to describe impact vs money as business goals. Because organizations not only work for profits, some entities also aim to serve the society. Therefore this template will ideally describe how businesses can create bifurcate division and how it can benefit them.